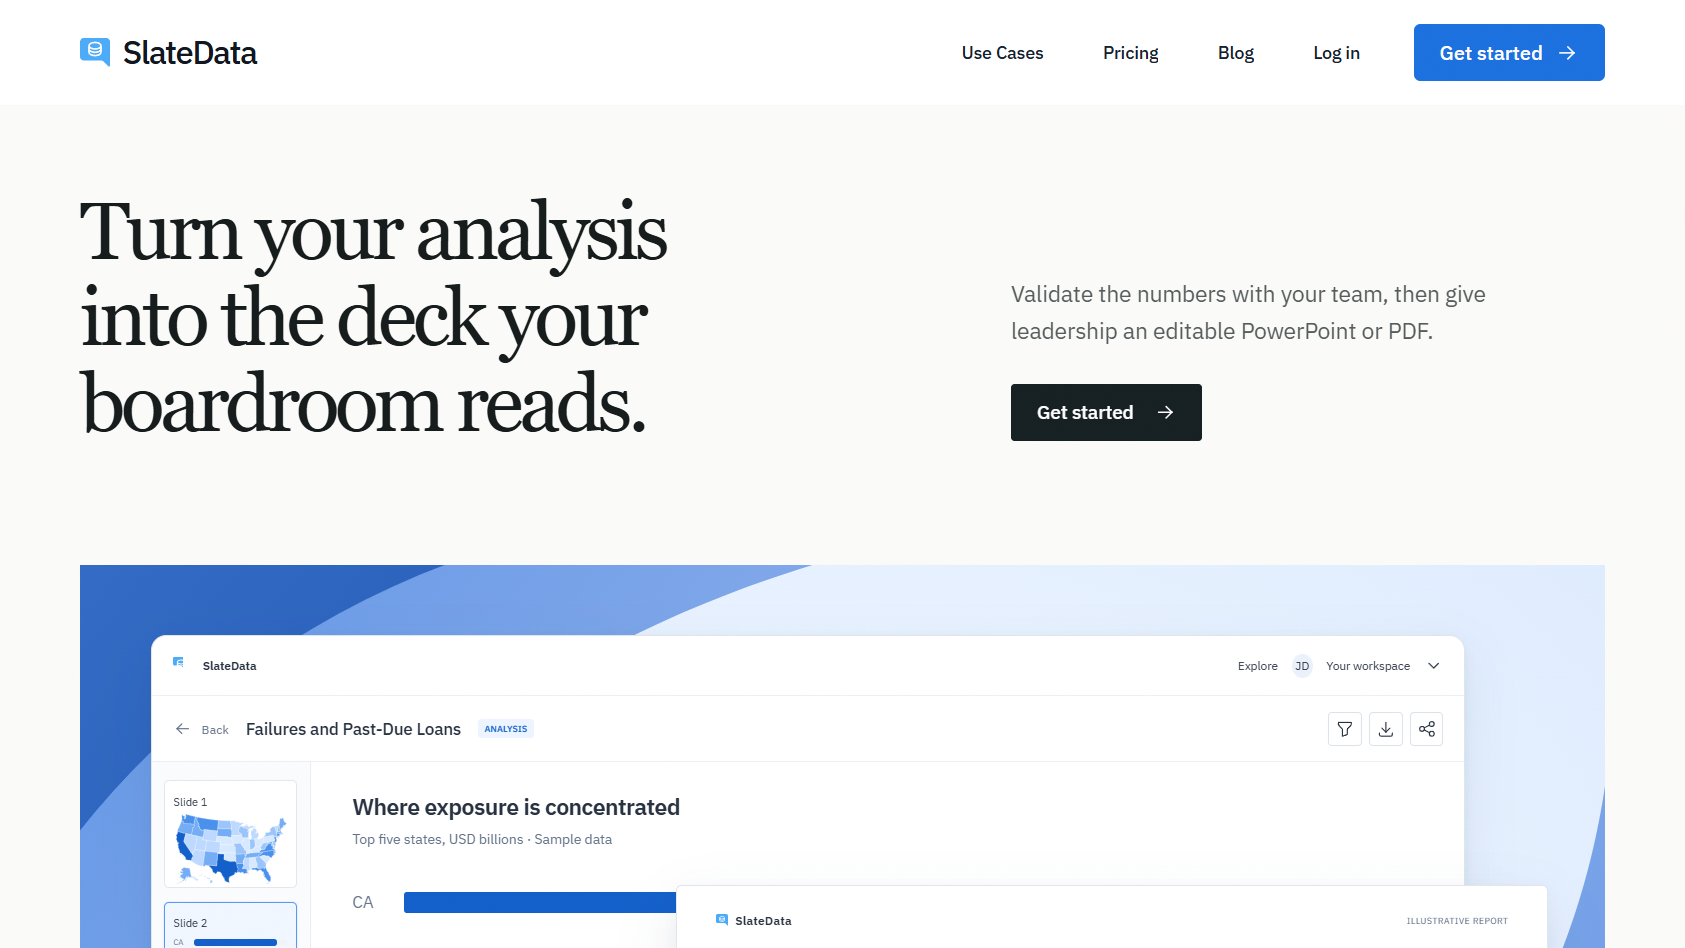
SlateData
JUN 2026An AI analytics tool that turns a plain-language question about your data into validated charts and an editable PowerPoint for leadership
- Role
- Software Engineer Intern
- Stack
- React, TypeScript, FastAPI, Python, PostgreSQL, AWS, Docker
- Outcome
- Built the presentation-mode toolbar and new chart options
Overview
Data analysts constantly query data, check the numbers, rebuild every chart in slides, and hope nobody asks where a figure came from. SlateData turns that week into an afternoon. You connect a data source, ask a question in plain language, check the answer with your team, and export a deck leadership can read on their own. I worked on building its features during my internship at Capital Technology Group.
How it works
- Connect and ask: Connect a data source and ask a question in plain language. SlateData writes the query and builds the chart.
- Validate as a team: Every chart shows the exact query and data behind it, so the team can check the numbers and refine the question until they trust the answer.
- Present: Arrange the charts into a deck, let SlateData draft the narrative, and export an editable PowerPoint or PDF.
So you might think… why not a dashboard?
- Defendable data: Every figure traces back to the query and source data behind it. When leadership asks where a number came from, the answer is already there.
- Built for how leadership reads: Leadership already reads PowerPoint and PDF. It is more likely for a deck to be opened rather than a dashboard link.
- No migration: It connects to the databases a team already has: PostgreSQL, MySQL, Databricks, ClickHouse, SQL Server, Elasticsearch, and CSV or Excel files. No ETL pipeline.
- Security: There is encryption at rest and in transit with SSO / SAML sign-in, and role-based access controls.
Challenges
- Tickets that were too big: I wrote backlog tickets for SlateData, and each one touched a lot of the codebase, which led to tons of merge conflicts. Now I split large features into small ones before they reach the backlog.
Takeaways
I learned how to work on a real-world engineering team with tech leads and product managers. I developed and created backlog tickets for the site, suggesting features and bug fixes the team might not have caught.
Result
- Added a toolbar for presentation mode.
- Added more data visualization options when choosing a visualization.