BACK TO PROJECTS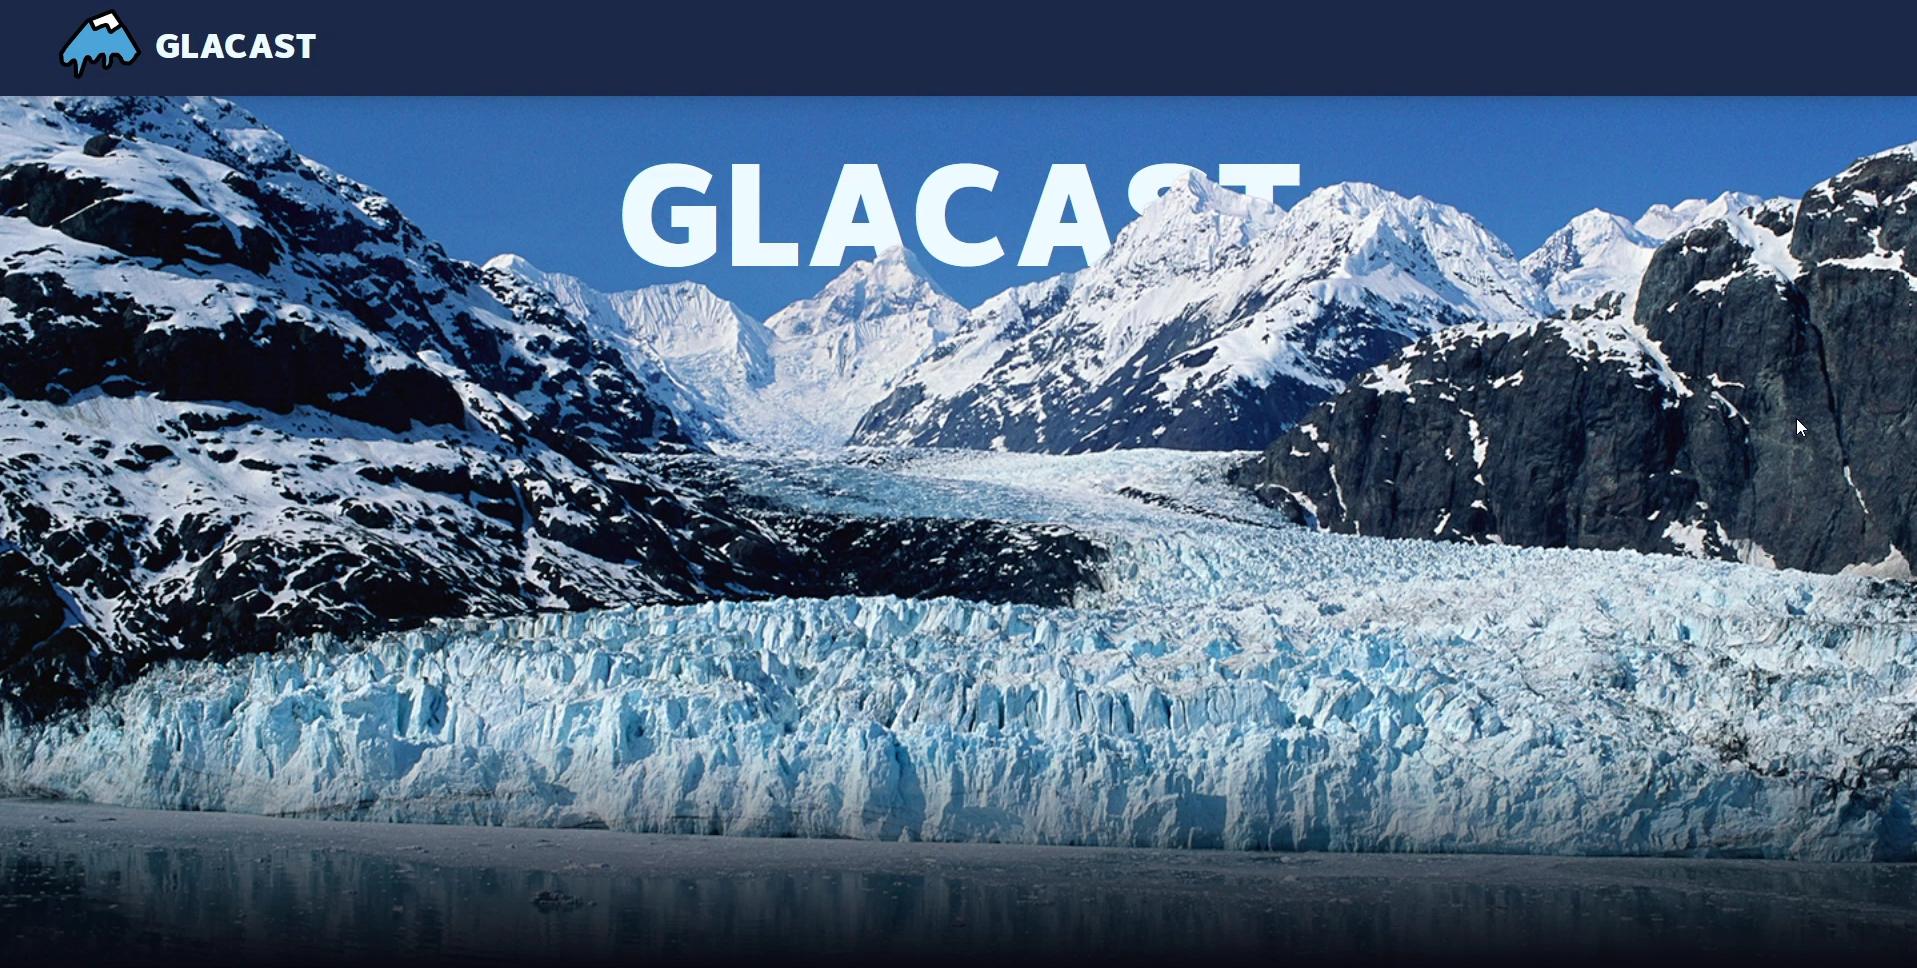
Glacast
APR 2026Explore glacier retreat through real satellite data with machine learning.
- Role
- Frontend Developer
- Stack
- React, TypeScript, FastAPI, Figma
- Outcome
- Shipped all three ML features in 36 hours
PATCH NOTES
Overview
Glacast shows glacier retreat from 1984 to today using Landsat satellite imagery, then forecasts the loss through 2050. You can explore well-known glaciers and switch between 1.5°C, 2°C and 3°C warming scenarios to see how much each one changes the future.
What I made
I built the frontend with a teammate who handled the backend and models.
- UI/UX design: Designed the interface in Figma.
- Frontend: Built the site in React and TypeScript, around the map and the satellite imagery timeline.
- API integration: Connected the frontend to our FastAPI backend, which serves the historical glacier measurements and the forecasts.
Challenges
- Data with gaps: Finding datasets that held up across decades was harder than we expected. Many sources had gaps, inconsistencies, or coverage that didn’t line up with each other.
- Scope that grew: We planned a simple slider for the imagery and ended up building a full scrubber across every year from 1984 to today, all inside the 36 hours.
Takeaways
- The gap between “data exists” and “data is usable” is enormous.
- How you show uncertainty matters as much as the number itself. Our forecasts show confidence intervals instead of a single line, so nobody reads a guess as a fact.
Result
- Shipped all three machine learning features within 36 hours.